Well, I think I've got a better handle on this VE table now. First off, here's what a VE table (B0101) might look like in EFILive..
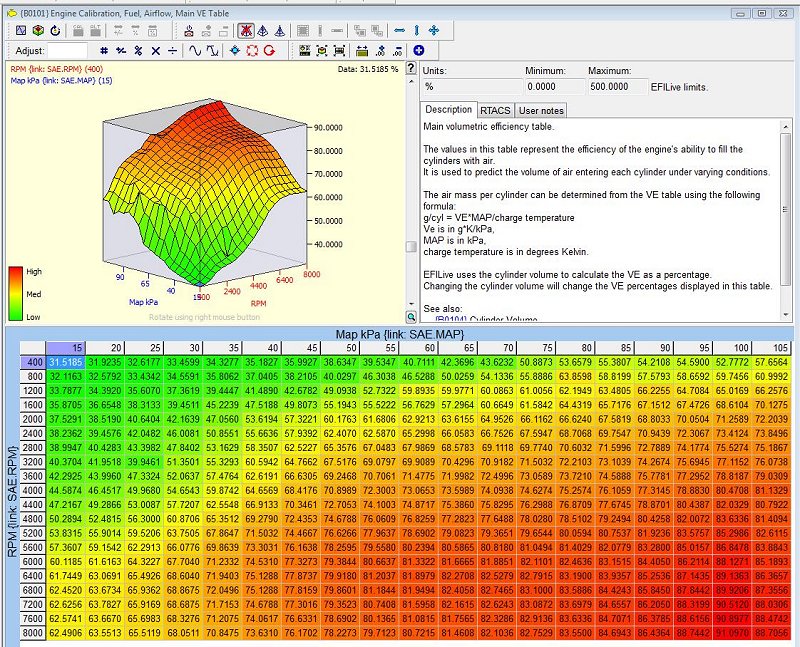
The values in each cell are a representation of how much air is PREDICTED to be able to fill the engine cylinders at the intersection of the manifold vacuum/pressure and the rpm of the engine, as shown in that table matrix. The PCM uses that value to determine how much fuel to inject into the cylinders when the engine is actually at the rpm level that corresponds with the intake manifold vacuum/pressure. This is pretty much the basis of what's known as a SPEED DENSITY tune.
What a MAP file is, therefore, is just a representation of the VE Table set up in the scan tool, set up to capture the DIFFERENCE between the commanded AFR and the actual AFR as determined by the wide band controller in the exhaust. This is done via a calculated PID that generates these values on the fly while the scan tool is capturing data. What this map file then represents is a correction factor for each cell of the VE table that sufficient data has been captured during a data logging run. That MAP file will look something like this:
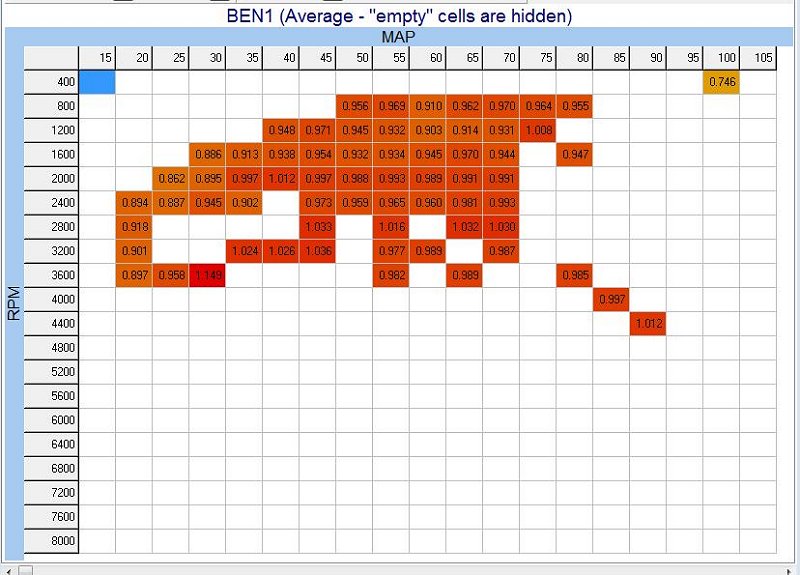
The values shown in the above are AVERAGE values of each cell with data in them. Cells that have had hits between zero and ten(10) are excluded from the MAP display so that the average value is more realistic of the actual differential.
So, now with that information captured in the MAP, what EFILive allows you to do is to cut those values in the MAP display from the scan tool, and then paste those values into the VE Table in the tune tool and at the same time also MULTIPLY those map cell values to the cell values in the VE table. This CORRECTS the values in the corresponding cells of the VE Table based on the difference determined in the MAP data. The values less than one (1) will therefore reduce the cell values in the VE Table cells, which will make that cell command a leaner value. Cells in the MAP that are greater than one (1) will increase the value of the VE Table cells, which will command the AFR to be richer. So a smaller value tells the PCM to expect LESS air and therefore inject LESS fuel into the cylinders. A larger cell value does the opposite, telling the PCM to expect MORE air in the cylinders, and therefore inject MORE fuel to compensate accordingly.
So increasing the numbers in the VE Table indicate a richer AFR, and decreasing those numbers indicate a leaner AFR. So this cut and paste of the MAP display values is a very quick and easy way to do what used to be manually capturing data from such cells, figuring out the percentage of difference needed, richer or leaner, and then manually multiplying EACH CELL in the VE Table by that percentage of difference. Yeah, I'll bet THAT was tedious!
Of course, the issue is trying to get enough "hits" in each cell of that MAP display to cover the entire VE Table. Which is why this sort of thing is certainly much easier to do on a dyno where you can control the RPM of the engine and the loading (on a load bearing dyno) of the engine in order to capture ALL the cells needed for a complete VE Table correction. Unfortunately, I have to do this the hard way on the street, which means I most likely will not be able to capture all the cells at the higher RPM range, under all vacuum/boost conditions.
Whew! That had me scratching my head for a while, but I think I understand it now....